CBAM's 2026 Trade-Exposure Map: Which Supplier Countries Carry the Highest Carbon Cost?
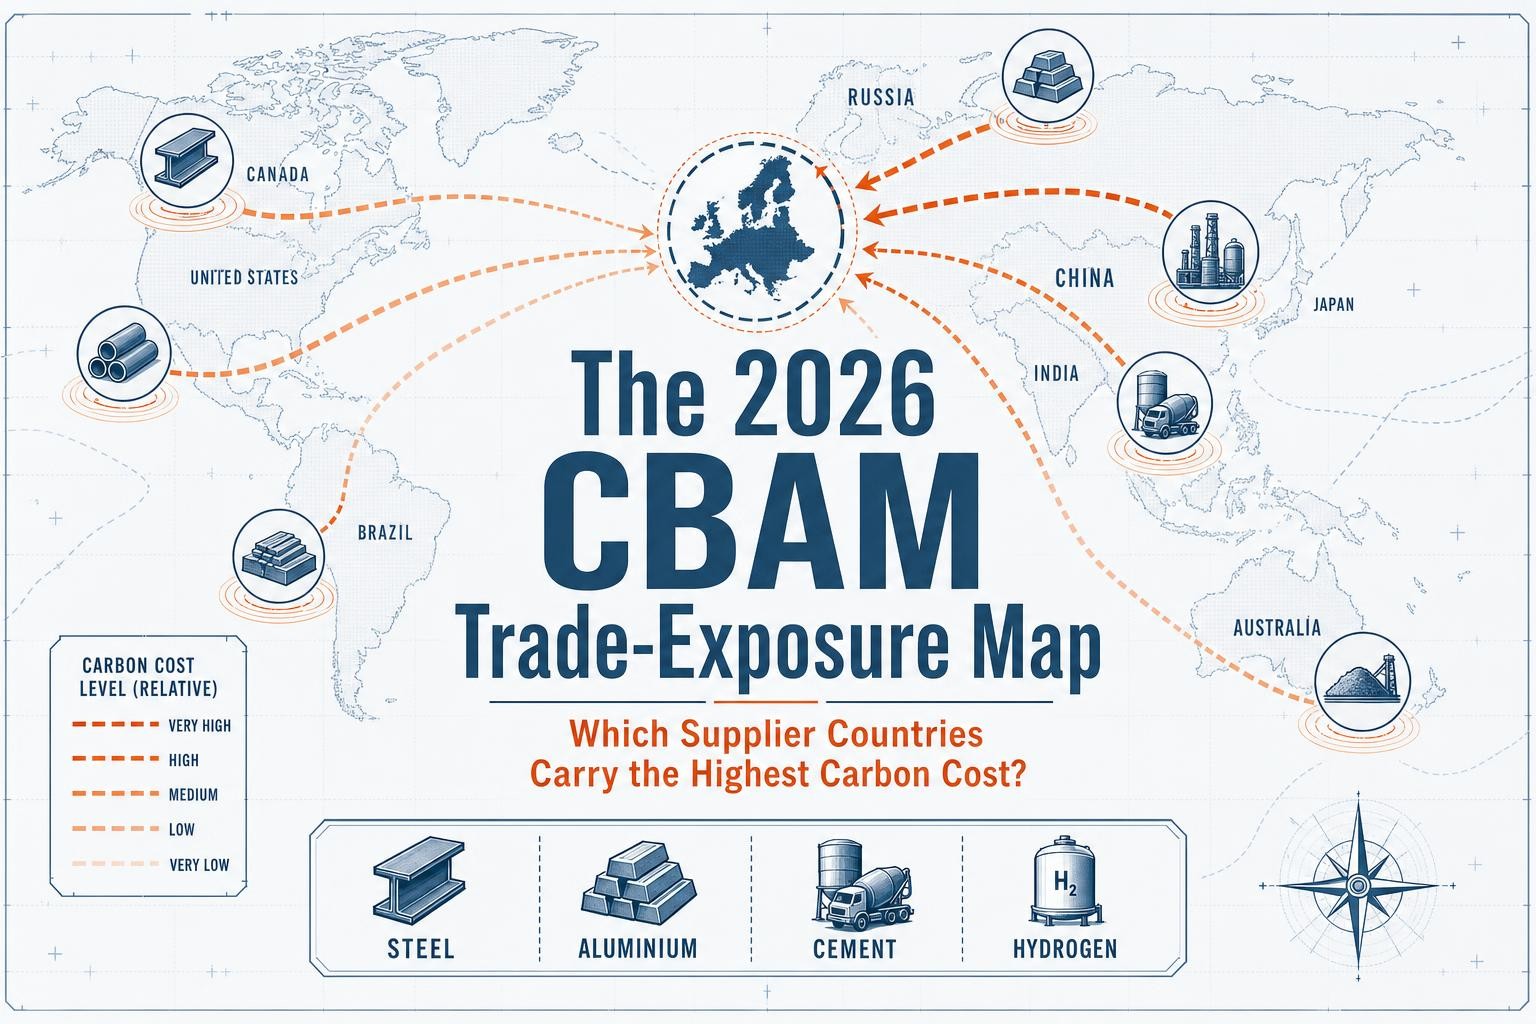
Where your goods come from now shapes what they cost to land in the EU. That's the practical consequence of CBAM entering its definitive phase on 1 January 2026. For two years, the mechanism was a reporting exercise. From 2026, it is a financial one - and the bill varies enormously depending on which country your supplier is in and, more precisely, how carbon-intensive their production process is.
This post is a country-level exposure map. It is not a sector explainer or a cost-calculation guide - those exist elsewhere on this site. It is a trade-strategy lens: which origins carry the highest CBAM burden today, why, and how that picture changes as the mechanism ramps toward full effect in 2034.
The Starting Point: Who Supplies CBAM Goods to the EU?
Three countries dominate the current picture. Under the current CBAM scope, China accounts for around 18% of EU imports of CBAM-covered goods, followed by India at approximately 7% and Russia at approximately 6%. Together, those three origins represent roughly 31% of all CBAM-eligible imports - a significant concentration of exposure in a small number of high-carbon-intensity economies.
That concentration matters because CBAM cost is not a flat tariff applied equally to all origins. It is a function of the embedded carbon in each shipment, priced at the EU ETS certificate rate. For Q1 2026, the European Commission set the CBAM certificate price at €75.36 per tonne of CO₂. The same tonne of steel from two different countries can carry very different CBAM bills depending entirely on how it was made.
The High-Exposure Origins
China: Volume Leader, Growing Cost Pressure
China's dominance in CBAM-covered imports makes it the single most strategically important origin to watch. The exposure is not just about today's cost - it is about trajectory.
Chinese steel risks losing its price advantage in the EU by the end of 2027 under CBAM if embedded emissions are not reduced. Chinese steelmaking remains heavily blast-furnace-based, with coal as the primary reductant. That production structure generates high embedded emissions per tonne, which translate directly into CBAM certificate obligations for EU importers.
The downstream picture is even more striking. European Commission analysis indicates that China would be the most exposed trading partner under a downstream CBAM extension, with additional exports to the EU of around €18 billion per year potentially pulled into scope. That figure dwarfs every other trading partner and reflects how deeply Chinese manufacturing is embedded in EU supply chains for steel- and aluminium-intensive finished goods.
China is not passive in response. The country is expanding its domestic ETS and building out provincial-level carbon accounting infrastructure - partly in anticipation of CBAM. But the pace of domestic carbon pricing remains well below EU ETS levels, meaning the deductible offset available to Chinese exporters is currently limited.
India: The Highest Steel Exposure
India's CBAM exposure in steel is structurally severe, and the numbers are stark. Typical Indian blast-furnace steel runs at approximately 2.1 tonnes of CO₂ per tonne of crude steel - roughly 50% above the EU benchmark average of around 1.8 tonnes. That gap is not a rounding error; it translates directly into a higher CBAM certificate obligation for every tonne imported.
The structural reasons are well-documented. India's steel sector relies heavily on coal-based blast furnace and basic oxygen furnace (BF-BOF) routes, coal-based direct reduced iron (DRI) - one of the most carbon-intensive steelmaking methods globally - and limited scrap recycling capacity, which constrains the shift to lower-carbon electric arc furnace (EAF) production.
Fastmarkets analysis of Q1 2026 default values found that BF-BOF steel imports from India would face CBAM costs of approximately €254 per tonne - compared to €100 per tonne for Turkish BF-BOF steel using the same default methodology. Importers using verified actual emissions data will pay less, but the underlying carbon intensity gap remains.
By 2032, Indian steel exporters are projected to face a 32% cost increase under CBAM - the steepest of any major exporting country, according to BCG analysis. With blast-furnace assets averaging just 18 years old, India's steel sector faces significant technology lock-in that makes rapid decarbonisation structurally difficult.
Russia: Sanctions Complicate the Picture
Russia accounts for around 6% of EU CBAM imports, but the practical trade picture is complicated by EU sanctions. Analysis by ING notes that while Russia has lower-than-average emissions per tonne of steel, EU sanctions - rather than CBAM - pose the greater challenge to its steel exports. For most EU importers, Russia is already effectively off the supplier list for strategic and compliance reasons. CBAM adds a further layer of cost, but it is not the primary constraint.
The Advantaged Origins: Why Production Route Beats Geography
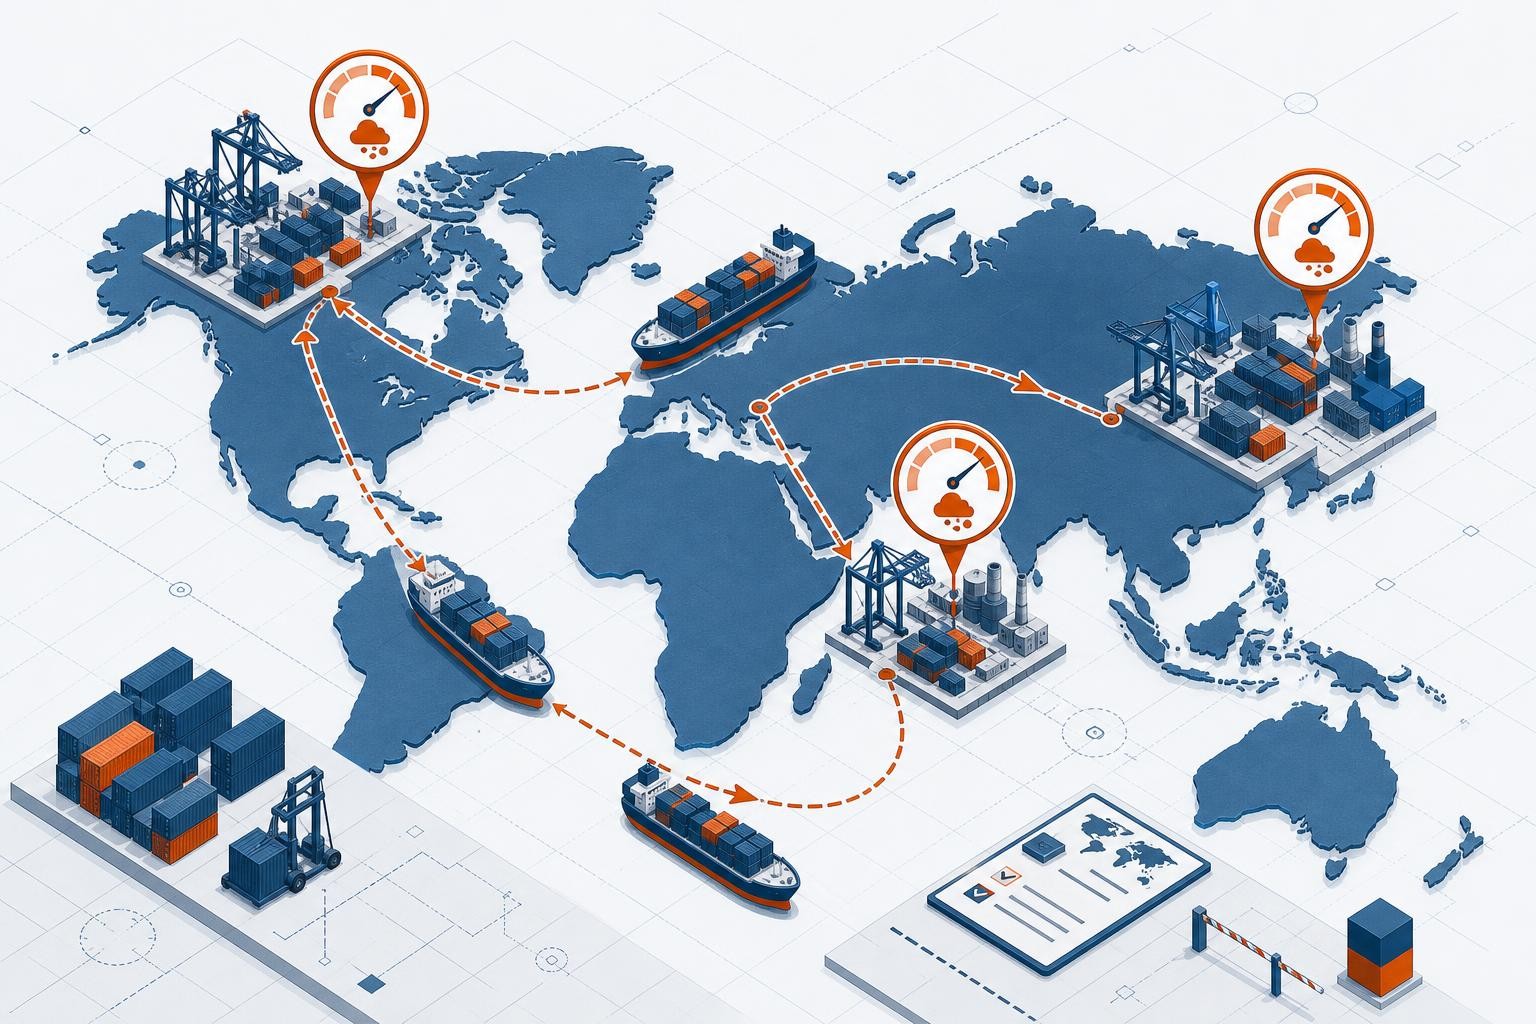
The most important insight from the exposure data is this: CBAM cost is driven by the carbon intensity of the production process, not by the country name on the invoice. Two suppliers in the same country can face very different CBAM bills. And some countries have structural production advantages that make them systematically cheaper to source from under CBAM.
Turkey: The EAF Advantage
Turkey is the clearest example of a structurally advantaged origin. Approximately 70% of Turkey's steel production uses electric arc furnace (EAF) technology - above the global average - resulting in significantly lower embedded carbon emissions compared to coal-based blast furnace production.
The cost difference is material. Already in 2026, Turkish steel can be cheaper than Chinese steel for EU importers despite higher production costs, because Turkey's EAF-based production carries far lower embedded emissions. For aluminium, Fastmarkets data shows Turkish aluminium facing a CBAM cost of approximately €36 per tonne - substantially lower than higher-carbon origins.
Turkey also has meaningful downstream exposure - around €8 billion per year of additional exports could be pulled into scope under the proposed downstream CBAM extension - but its structural production advantage in steel means it enters that expansion from a stronger position than China or India.
One important caveat: Turkey's EAF advantage depends on verified actual emissions data being submitted. Turkish industry has raised concerns that CBAM default values, applied when verified data is absent, can overstate emissions for EAF producers - in some cases assigning values higher than those for blast-furnace origins. The lesson is that the EAF advantage only materialises in practice if suppliers invest in verification.
The Underlying Driver: Three Variables That Determine Your CBAM Bill
CBAM cost per tonne is determined by three variables — not one:
- Production route and process carbon intensity — EAF/scrap-based steel emits a fraction of BF-BOF coal-based steel. The CBAM benchmark for scrap-EAF steel (0.072 tCO₂/t) is roughly 19 times lower than for BF-BOF (1.370 tCO₂/t).
- Grid carbon intensity — For aluminium and other electricity-intensive goods, the carbon content of the supplier's national grid feeds directly into the embedded emissions calculation.
- Deductible domestic carbon price — If a supplier country operates a qualifying carbon pricing scheme, the carbon cost already paid can be deducted from the CBAM bill. Countries with credible, high-price domestic carbon markets reduce their exporters' net CBAM obligation.
This framework explains why Turkey outperforms China on steel despite being geographically closer and having higher nominal production costs. It also explains why a low-carbon Indian producer using renewable electricity and EAF technology can be more competitive in the EU than a high-carbon Indian blast-furnace mill - even within the same country.
The Ramp: Why Today's Gaps Become Tomorrow's Crises
The exposure gaps described above are based on a CBAM factor of just 2.5% in 2026. That is not a typo. The CBAM factor - the share of embedded emissions that triggers a certificate obligation - starts at 2.5% in 2026 and ramps to 100% by 2034, with the steepest single-year jump occurring between 2029 and 2030, when it rises from 22.5% to 48.5%.
The practical implication: the net certificate cost at full phase-out in 2034 is 40 times larger than in the first year of the definitive period. A cost that feels manageable in 2026 becomes a defining competitive variable by 2030, and a potential market-exit trigger by 2034 for high-carbon origins that have not decarbonised.
Centre for European Reform analysis estimates that by 2034, CBAM fees will translate into cost increases of around 50% relative to 2026 levels for steel producers in both India and China. EU-based producers will also face cost increases as free allowances phase out, but those are estimated at around 12% over the same period - a much smaller step change.
Sourcing decisions made today - supplier contracts, capital commitments, long-term supply agreements - will be locked in as the ramp accelerates. The time to factor CBAM into total landed cost is now, not in 2029.
The Downstream Extension: A Second Wave of Exposure
The current CBAM scope covers six primary sectors. But the downstream extension - covering steel- and aluminium-intensive finished goods such as car doors, gearboxes, and household appliances - is already moving through the legislative process. In June 2026, EU member states agreed to broaden CBAM to approximately 180 downstream product categories.
This matters for sourcing teams beyond metals procurement. If you buy finished goods with significant steel or aluminium content from China, Turkey, or other exposed origins, the downstream extension will eventually bring those imports into scope. The country-level exposure map shifts when downstream products are included: the US share of CBAM-covered EU imports would rise from around 4% to 13-14% under the largest expansion scenario.
Practical Sourcing Checklist
Use this interactive tool to assess your supplier portfolio's CBAM exposure profile:
Beyond the tool, the core sourcing principles are straightforward:
- Ask for verified actual emissions, not defaults. Default values carry a surcharge (rising from 10% in 2026 to 30% from 2028) and often overstate emissions for efficient producers. Verified data is both cheaper and more accurate.
- Favour EAF and low-carbon-grid origins where commercially viable. The production route is the single most important cost variable. A scrap-EAF supplier in Turkey or a renewable-powered mill in any country will carry a fraction of the CBAM cost of a coal-based blast-furnace competitor.
- Factor CBAM into total landed cost, not just unit price. A cheaper invoice price from a high-carbon origin may already be more expensive on a landed-cost basis in 2026 - and will almost certainly be more expensive by 2028-2030 as the factor ramps.
- Watch the downstream extension. If you buy finished goods with significant steel or aluminium content, map your supplier origins now. The extension is moving faster than many procurement teams anticipated.
- Treat these as estimates, not precise per-shipment figures. Trade patterns, carbon prices, and policy details continue to evolve. Build scenario ranges into your planning, not single-point forecasts.
All country-level cost figures cited are estimates based on publicly available default values and modelling as of mid-2026. Actual CBAM obligations depend on verified facility-level emissions data, the applicable CBAM factor for the year of import, and any deductible carbon price paid in the country of origin. This post is for informational purposes only and does not constitute legal or financial advice.
Related reading
CBAM and Indirect Emissions: Why the Annex II Split Matters for Steel, Aluminium, and Hydrogen Importers
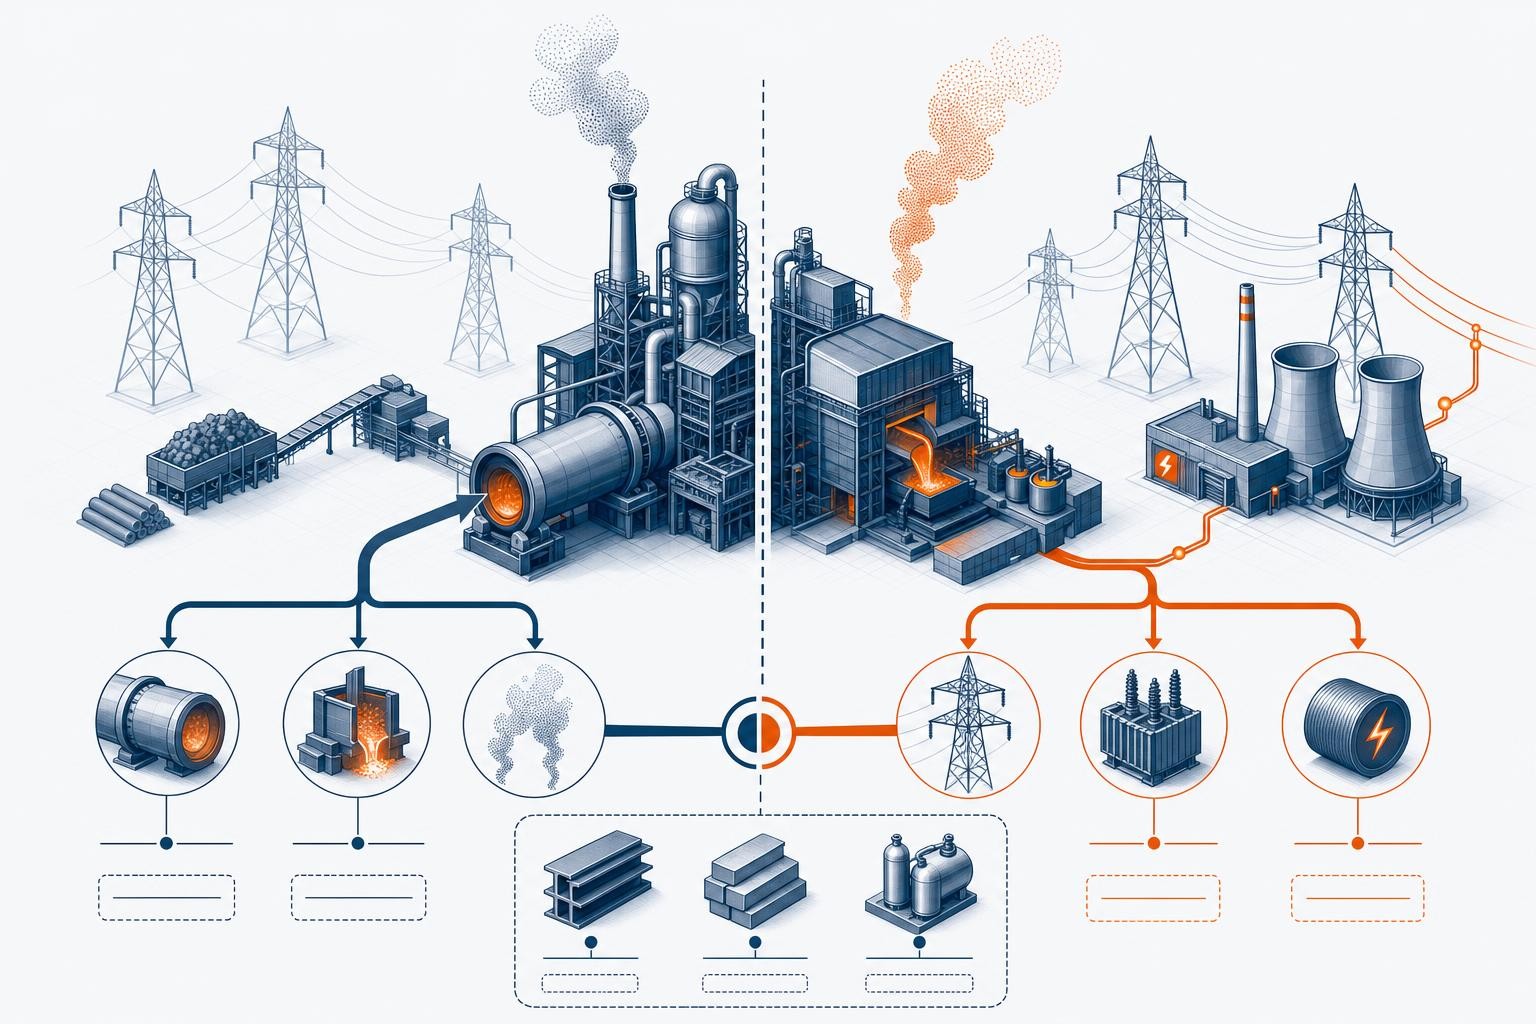
CBAM prices indirect emissions for cement and fertilisers but not for steel, aluminium, or hydrogen - and the reason why matters for your compliance strategy. Here's the full mechanics.
Making Your Supply Contract CBAM-Ready: A Clause-by-Clause Drafting Guide
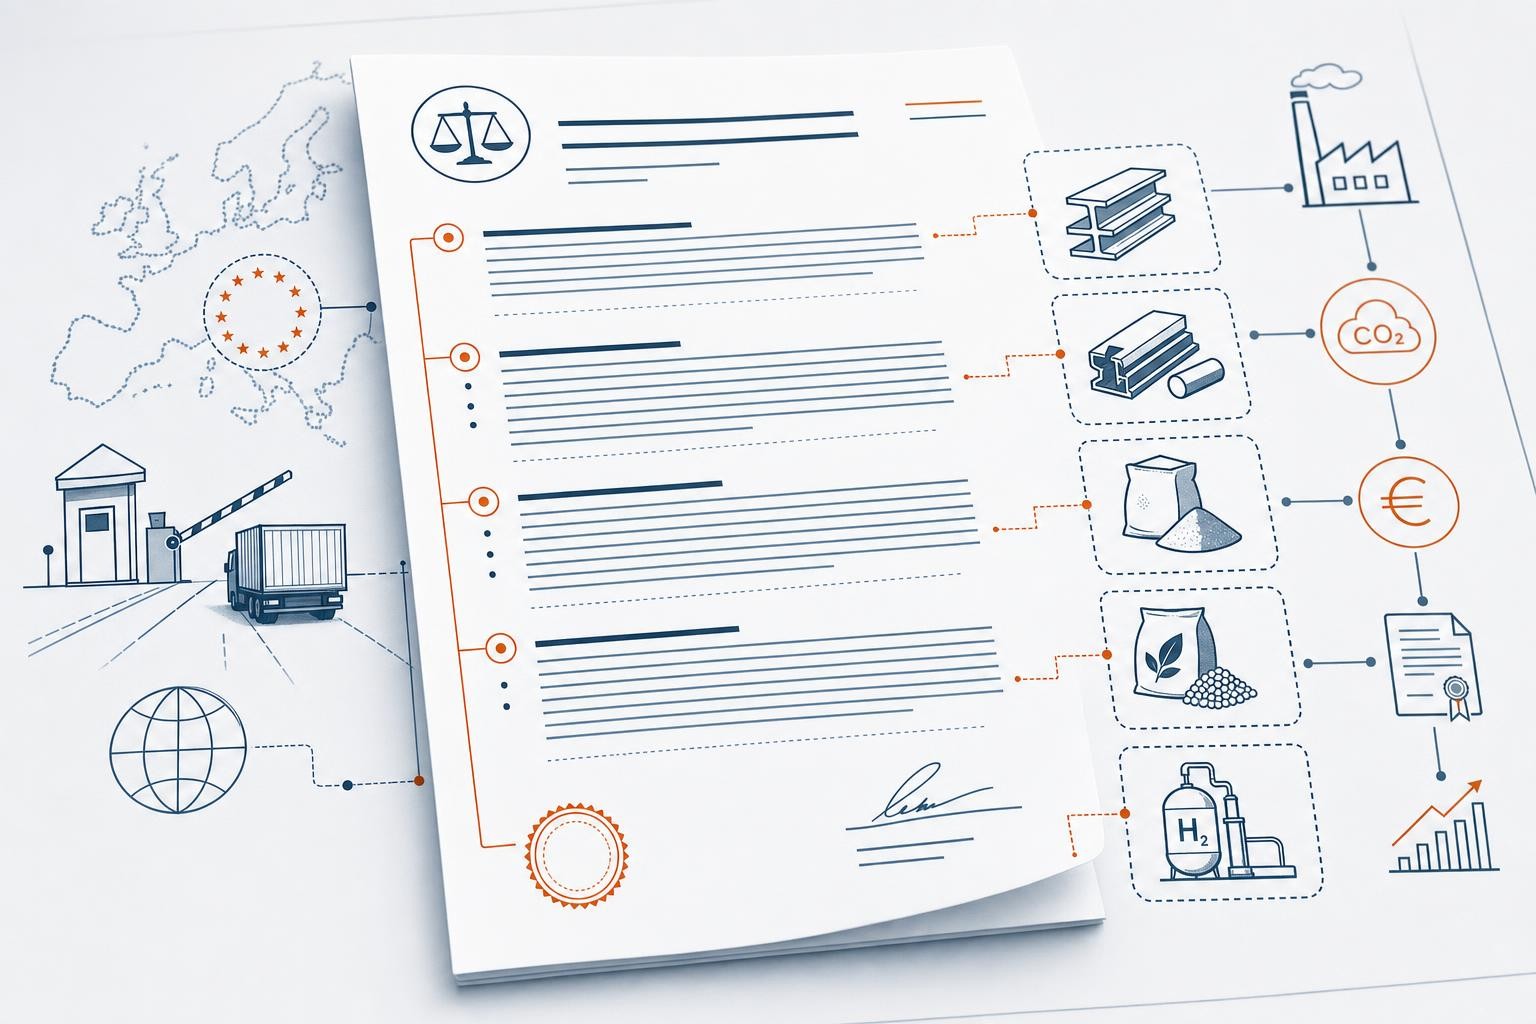
CBAM is now a contracting problem. This clause-by-clause guide covers emissions data, verification, price pass-through, Incoterms, indemnity, and change-in-law for EU importers of steel, aluminium, cement, fertilisers, and hydrogen.
CBAM and Customs Procedures: How Release for Free Circulation Changes Everything
CBAM obligations attach at release for free circulation, not at physical arrival. That single fact makes your choice of customs procedure a genuine compliance and cash-flow lever. Here's the practical guide.