Why Your CBAM Bill Doubles by 2030: The ETS Free-Allocation Countdown
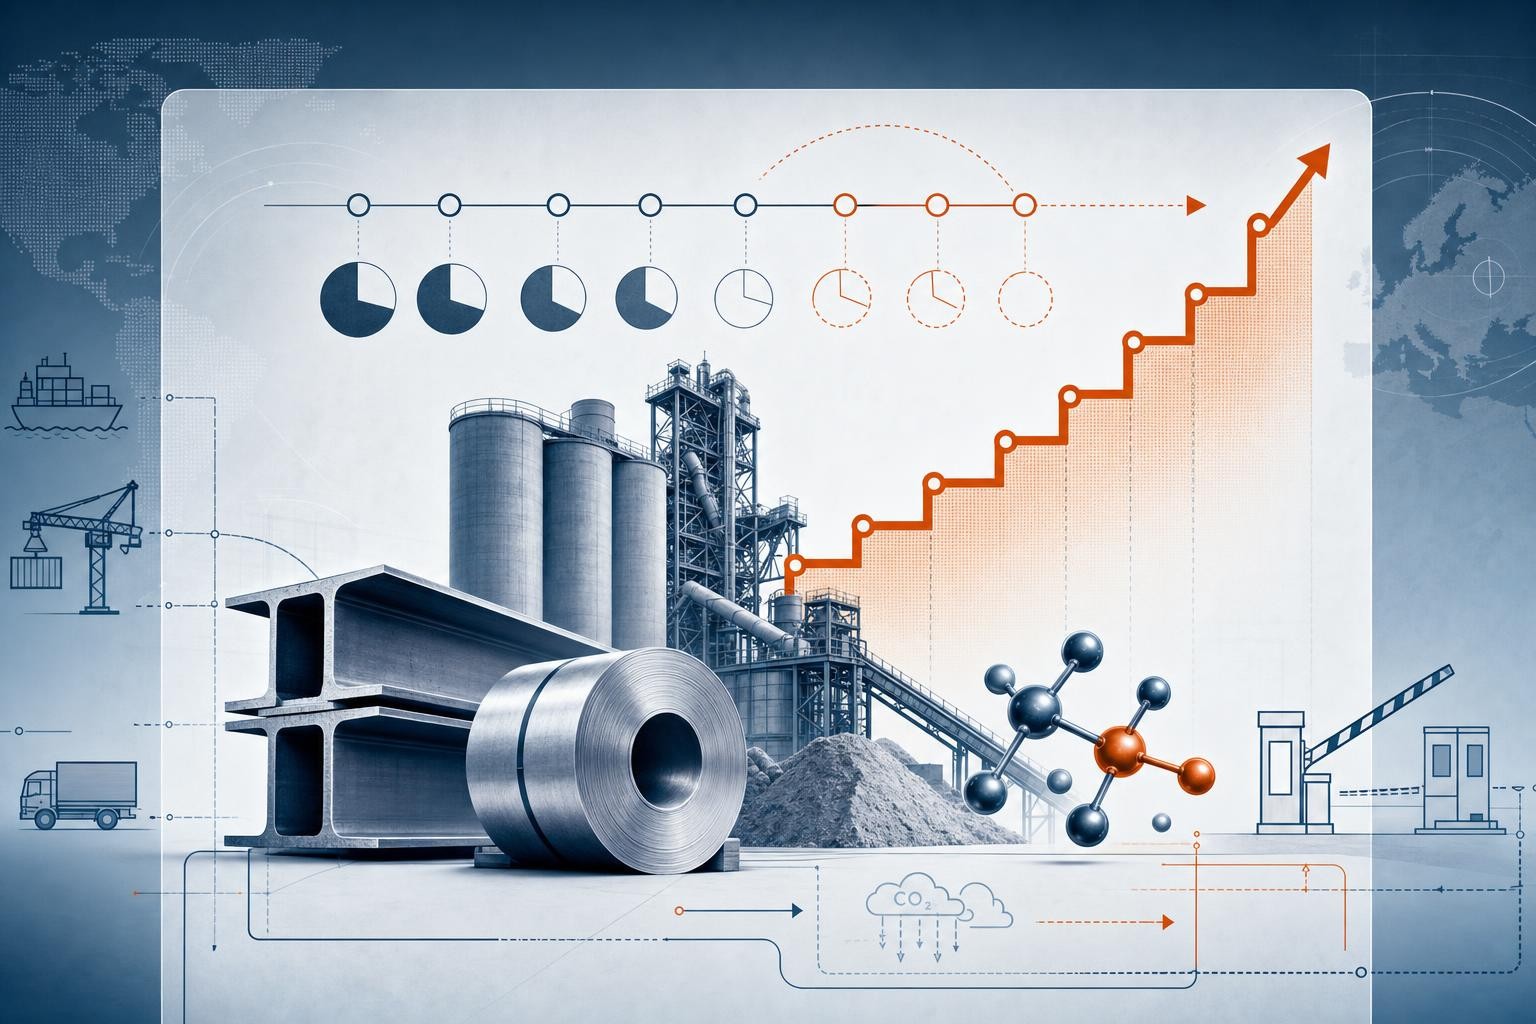
If your CBAM bill looks manageable right now, that's by design - and it won't last. The mechanism was deliberately calibrated to start cheap and escalate steeply, tracking a parallel process happening inside the EU that most importers never see: the systematic withdrawal of free carbon allowances from EU producers. Understanding that withdrawal schedule is the only way to budget CBAM accurately beyond the next 12 months.
This post focuses tightly on the coupling mechanism - why the two systems move in lockstep, what the exact ramp looks like year by year, and where the sharpest cost jump is hiding.
The Mirror-Image Logic: One Goes Up, the Other Goes Down
The EU Emissions Trading System (EU ETS) has long given free allowances to energy-intensive industries - steel, cement, aluminium, fertilisers, hydrogen - to shield them from carbon leakage while the rest of the world caught up on carbon pricing. As long as those free allowances existed, charging importers the full carbon price would have been unfair: EU producers weren't paying it either.
CBAM resolves this by creating a direct coupling. The CBAM factor - the percentage of a shipment's embedded emissions that generates a certificate obligation - equals, in any given year, the percentage by which EU free allocation has already been cut. As EU producers lose their free allowances, importers pay on a matching share of their emissions. Neither side gets a structural advantage at the margin.
The European Commission's own taxation and customs pages confirm this design: the gradual CBAM introduction "is aligned with the phase-out of free allowances under the EU ETS to support the decarbonisation of EU industry." DEHSt, Germany's national emissions authority, states it plainly: industrial activities covered by CBAM "will receive a free allocation which will gradually decrease to zero from 2026 to 2034 and will be replaced step-by-step by the CBAM."
This is not a temporary adjustment. It is a nine-year, legislated countdown.
The Full Phase-Out Schedule
| Year | CBAM Factor (% of emissions charged) | Free Allocation Remaining | Note |
|---|---|---|---|
| 2026 | 2.5% | 97.5% | Definitive phase begins |
| 2027 | 5% | 95% | |
| 2028 | 10% | 90% | |
| 2029 | 22.5% | 77.5% | |
| 2030 | 48.5% | 51.5% | ⚠️ Steepest single-year jump |
| 2031 | 61% | 39% | |
| 2032 | 73.5% | 26.5% | |
| 2033 | 86% | 14% | |
| 2034 | 100% | 0% | Full CBAM, zero free allocation |
Source: Clean Energy Wire / ICAP, citing Regulation (EU) 2023/956 and the revised EU ETS Directive.
The CBAM factor rises in nine steps, from 2.5% in 2026 to 100% by 1 January 2034, when EU ETS free allocation for CBAM-covered sectors reaches zero. The ICAP EU ETS factsheet confirms the free-allocation percentage decreases "gradually from 97.5% in 2026, to 51.5% in 2030 and down to 14% in 2033."
The 2029-2030 Cliff: Your Biggest Planning Risk
Most importers are focused on 2026 and 2027. The real planning problem is 2030.
The steepest single-year jump in the CBAM factor occurs between 2029 and 2030, when it more than doubles - rising from 22.5% to 48.5%. That is a 26-percentage-point increase in a single calendar year, larger than the cumulative increase across the entire 2026-2029 period combined.
For BF-BOF steel, cbamguide.com calculates that this single step translates to a net cost increase of approximately €39 per tonne of steel (from roughly €33.75/t to €72.75/t at a €75 ETS price). For primary aluminium, the equivalent jump is around €29.25 per tonne in one year.
Supply chain decarbonisation decisions that take 3–5 years to implement — switching to low-carbon steel suppliers, negotiating verified emissions data, investing in process changes — need to begin no later than 2026 to take effect before the 2030 step. Financial models that use 2026 or 2027 CBAM costs as a 'run rate' will systematically underestimate 2030 exposure.
The phase-out "will begin at a slow rate before accelerating towards the end of the period," as ICAP notes - which is precisely why the early years create a false sense of security.
A Worked Example: Same Shipment, Very Different Bills
To make the ramp concrete, consider a single shipment of 10,000 tonnes of hot-rolled coil with embedded emissions of 1.9 tCO₂ per tonne (a typical BF-BOF figure), and a flat ETS/CBAM certificate price of €75/tCO₂ for comparison purposes.
The European Commission published the first-ever official CBAM certificate price on 7 April 2026, set at €75.36 per tonne of CO₂ equivalent for Q1 2026.
The formula: Embedded emissions × CBAM factor × certificate price = gross CBAM obligation
(Before any deduction for carbon price paid in the country of origin.)
| Year | Embedded CO₂ (tCO₂) | CBAM Factor | Gross CBAM Cost |
|---|---|---|---|
| 2026 | 19,000 | 2.5% | €35,625 |
| 2028 | 19,000 | 10% | €142,500 |
| 2029 | 19,000 | 22.5% | €320,625 |
| 2030 | 19,000 | 48.5% | €691,125 |
| 2034 | 19,000 | 100% | €1,425,000 |
The same shipment costs nearly 20× more in 2034 than in 2026 - and more than twice as much in 2030 as in 2029. This is not a price-driven increase; it is a factor-driven one, baked into legislation.
The SEFA Adjustment: How Free Allocation Reduces Your Certificate Count
One technical detail matters for accurate budgeting. The certificate obligation is not simply embedded emissions × CBAM factor. It is reduced by a SEFA (Specific Embedded Free Allocation) adjustment, which reflects the sector-specific benchmark free allocation that EU producers in the same product category still receive.
The SEFA methodology, established in Implementing Regulation (EU) 2025/2620, converts the abstract CBAM factor percentage into a concrete certificate reduction for each product category using sector-wide benchmarks published annually by the Commission. Importers cannot calculate their reduction based on which specific EU company they compete with - the methodology is sector-wide, not firm-specific.
In practical terms: as free allocation shrinks, the SEFA adjustment shrinks with it, and your net certificate obligation rises. The two move in lockstep by design.
Why the EU Built It This Way
The policy logic is a level playing field at the margin. As EU producers lose free allowances, they face rising ETS costs on the same tonne of steel or cement. CBAM ensures that non-EU exporters face a parallel, rising obligation on the same tonne. Neither side gains a structural advantage from the carbon pricing gap.
There is a secondary layer worth noting: from 2026 to 2030, EU ETS free allocation for CBAM-covered sectors is conditional on installations implementing energy efficiency measures (based on audits or energy management systems) and carbon neutrality plans for the worst-performing installations. This conditionality - confirmed by both ICAP and DEHSt - applies only to EU producers, not to importers. But it explains the policy direction: the EU is simultaneously tightening what EU producers must do to keep their remaining free allocation, while steadily reducing how much they get. The trajectory is one-way.
What to Do Now
The ramp is fixed. The certificate price is not. What you can control is your preparation.
Use the full nine-step factor schedule, not just 2026 figures. Run at least three ETS price scenarios (€60, €75, €100/tCO₂). Any supply contract with a term beyond 24 months needs the 2030 factor modelled in. A three-year steel contract priced on 2026 CBAM costs will be structurally underpriced by 2029.
Default emission values are deliberately punitive and will carry mark-ups phased in over three years. Verified actual emissions data almost always produces a lower certificate obligation. The time to establish data-sharing agreements and verification workflows with non-EU producers is before the 2027 surrender deadline, not after.
Any contract signed in 2026 at import prices that assume the 2026 CBAM cost will be structurally underpriced by 2029. Include a CBAM data clause requiring suppliers to provide verified actual emissions data in a specified format, and a cost-adjustment mechanism tied to the CBAM factor schedule.
The 2029-to-2030 jump is the single largest cost event in the CBAM timeline. Budget cycles, supplier renegotiations, and sourcing decisions that need to be in place by 2030 must be initiated by 2026–2027 at the latest. Mark it now.
The Commission publishes sector-specific SEFA values annually. These determine the exact certificate reduction you receive. Monitor them — particularly for steel and aluminium, where benchmark updates can materially shift your net obligation even if the CBAM factor itself is unchanged.
Model Your Own Exposure Across the Full Ramp
Use the calculator below to see how your CBAM bill changes year by year as the factor escalates - enter your shipment volume, emission intensity, and an ETS price assumption to project costs from 2026 through 2034.
The Bottom Line
Your CBAM bill is not a fixed compliance cost - it is a legislated escalator. The factor ramp is published, the schedule is binding, and the 2029-2030 cliff is the single largest cost event in the timeline. The importers who treat 2026 as a planning baseline rather than a planning ceiling are the ones who will face the sharpest surprises.
The time to model 2030 is now, while the numbers are still small enough to act on.
Related reading
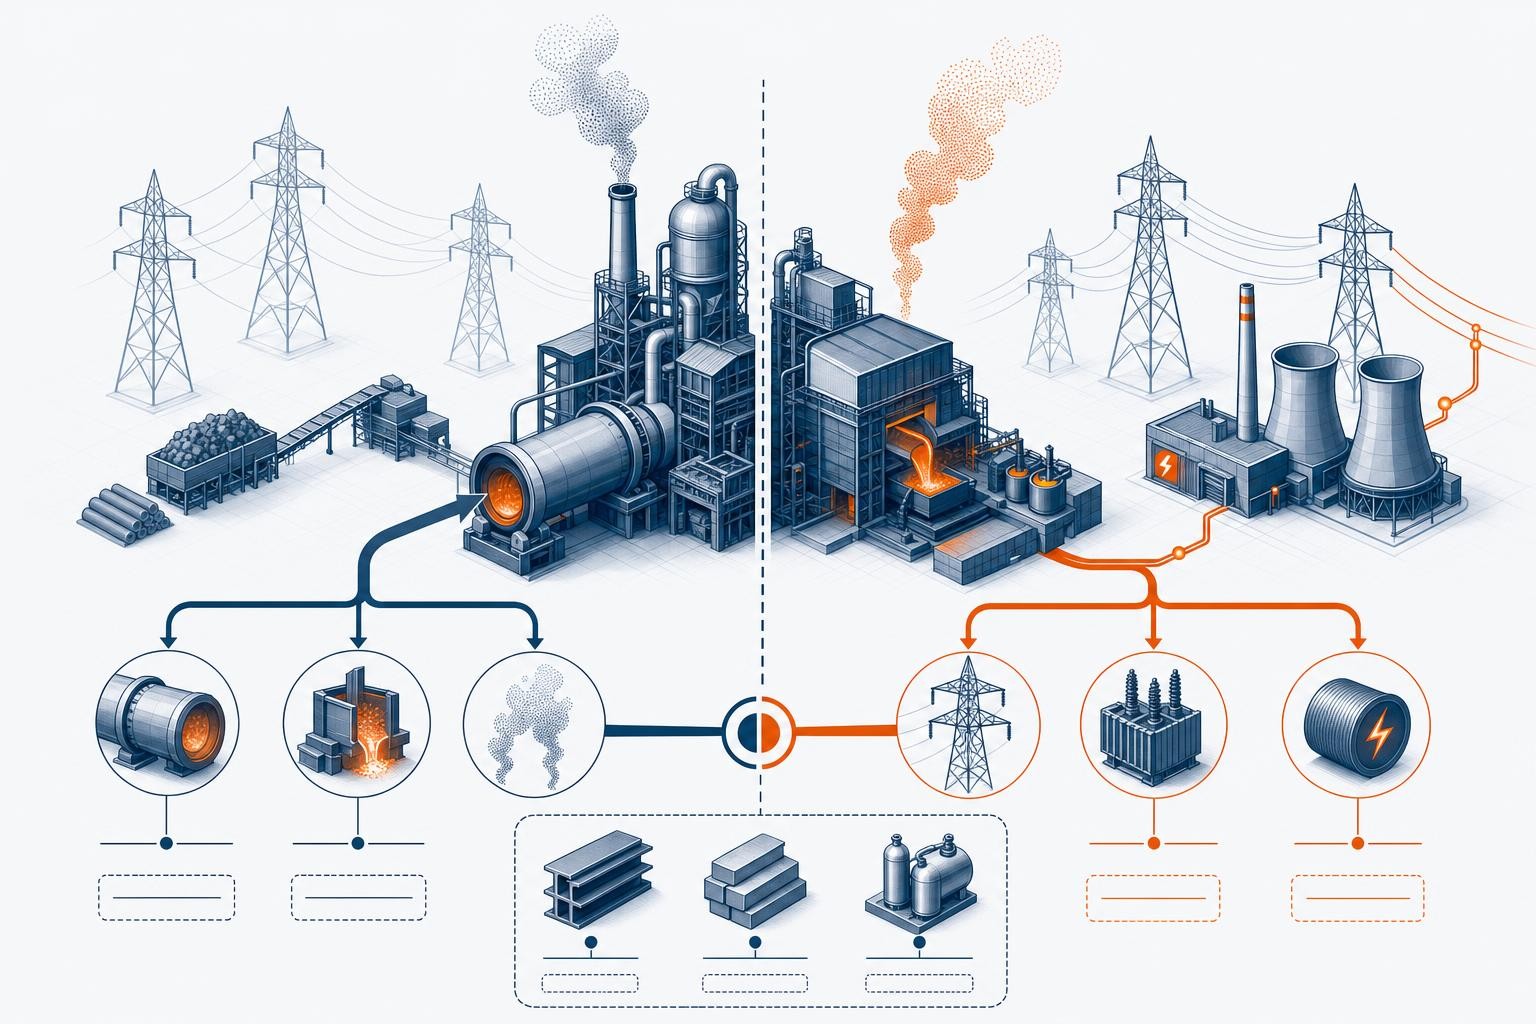
CBAM and Indirect Emissions: Why the Annex II Split Matters for Steel, Aluminium, and Hydrogen Importers
CBAM prices indirect emissions for cement and fertilisers but not for steel, aluminium, or hydrogen - and the reason why matters for your compliance strategy. Here's the full mechanics.
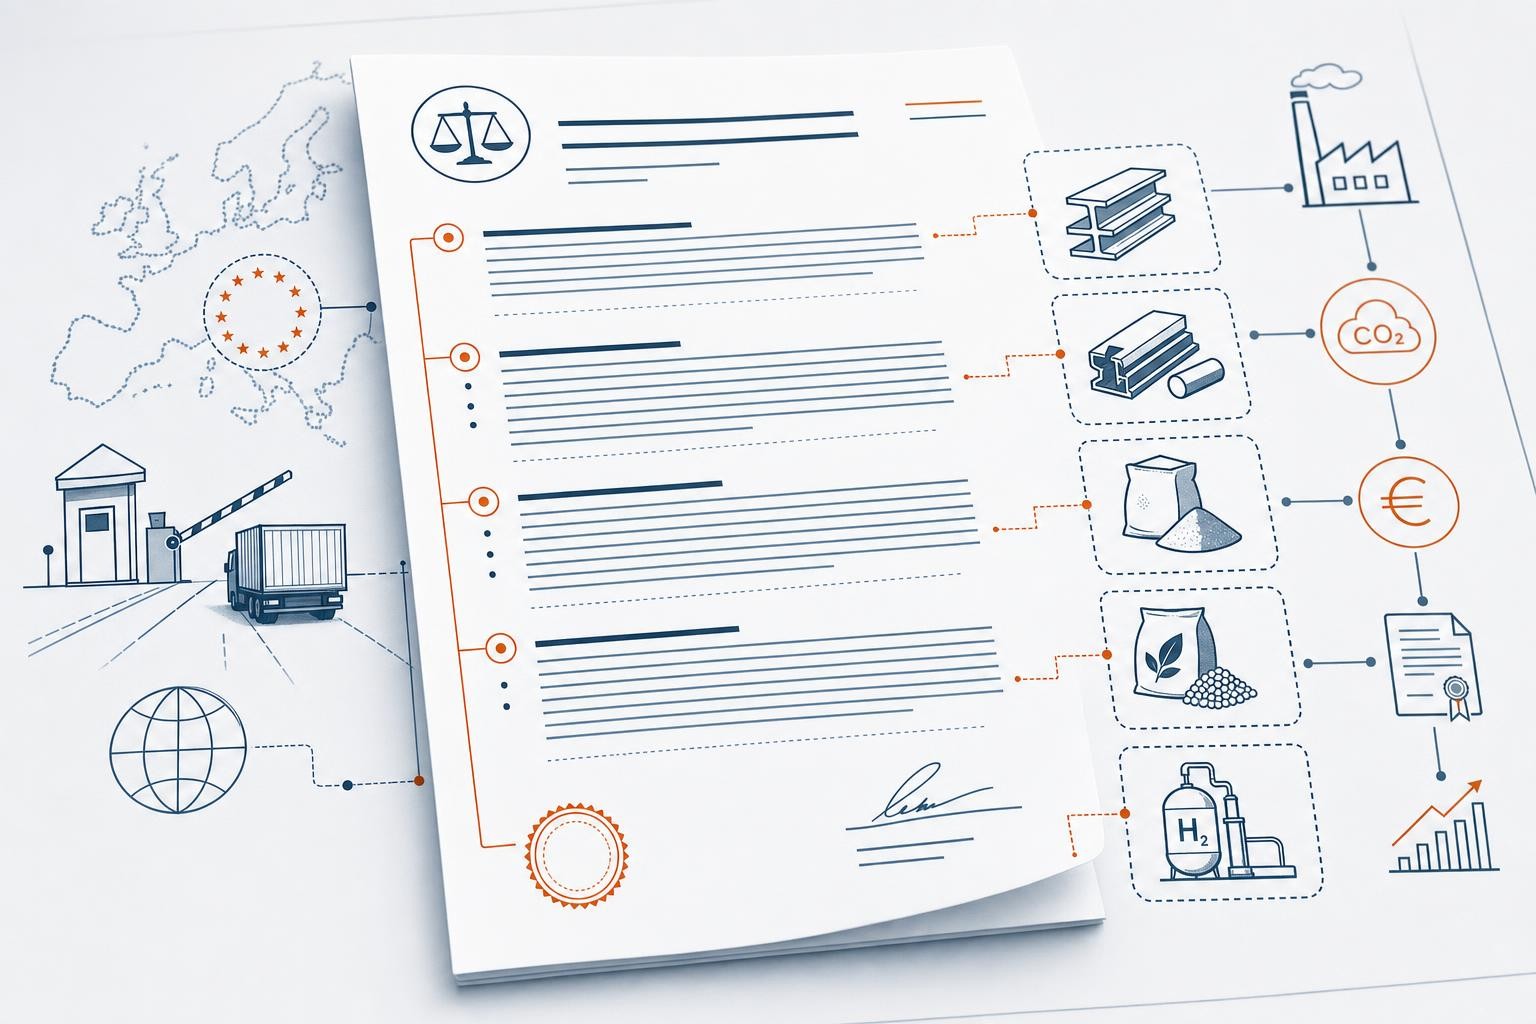
Making Your Supply Contract CBAM-Ready: A Clause-by-Clause Drafting Guide
CBAM is now a contracting problem. This clause-by-clause guide covers emissions data, verification, price pass-through, Incoterms, indemnity, and change-in-law for EU importers of steel, aluminium, cement, fertilisers, and hydrogen.
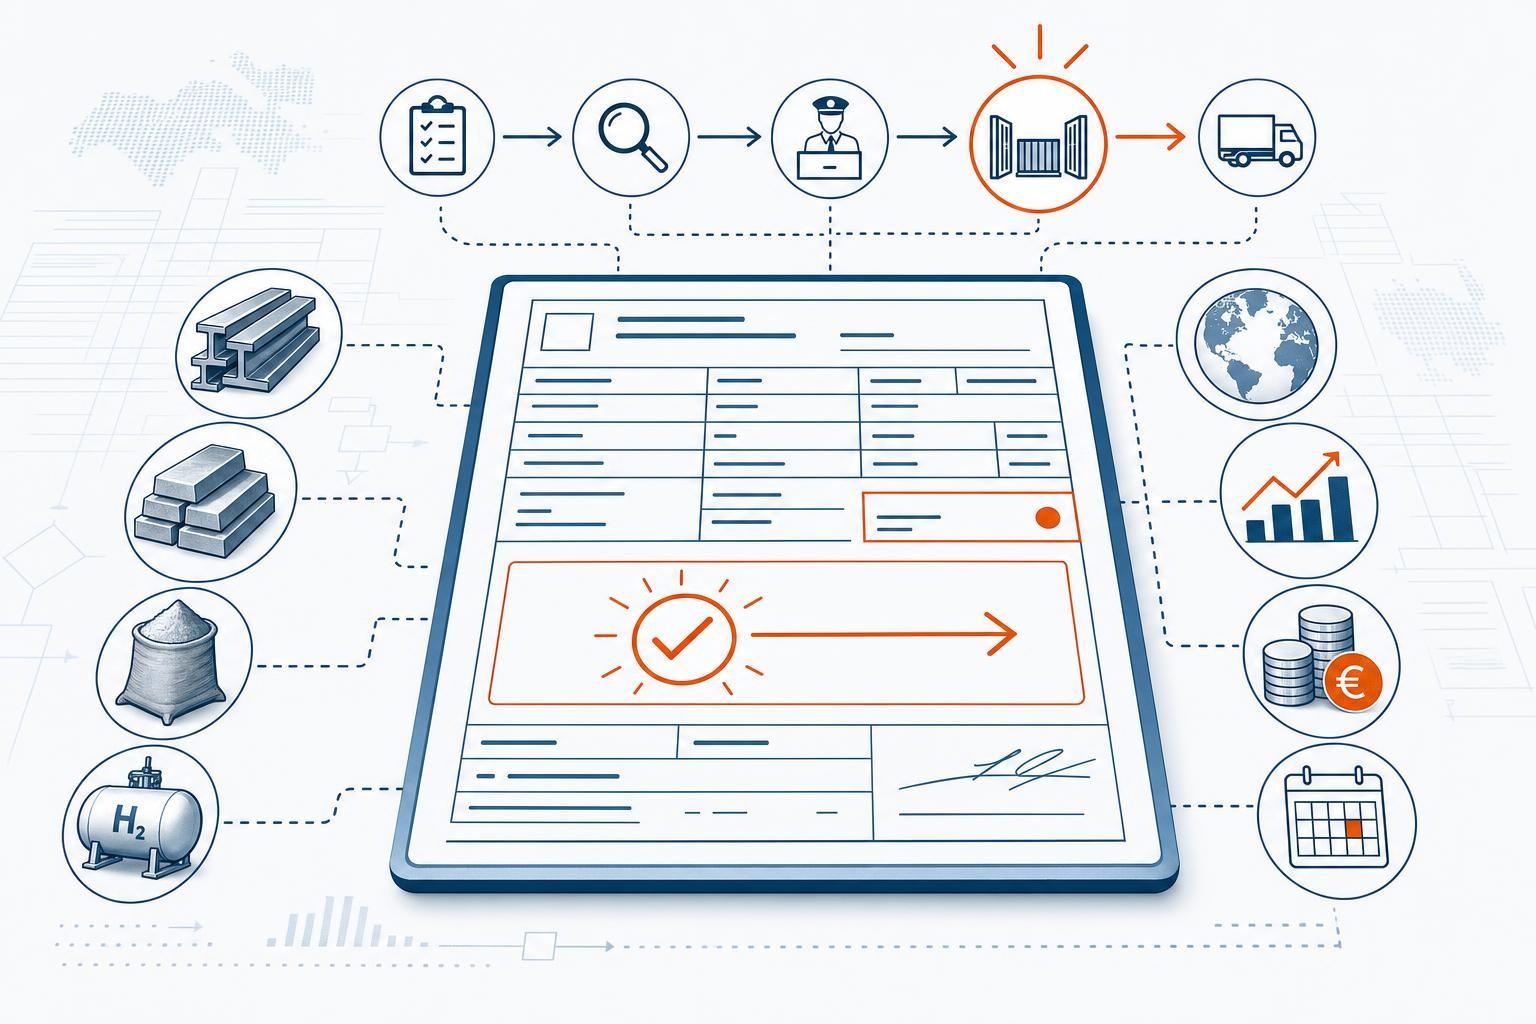
CBAM and Customs Procedures: How Release for Free Circulation Changes Everything
CBAM obligations attach at release for free circulation, not at physical arrival. That single fact makes your choice of customs procedure a genuine compliance and cash-flow lever. Here's the practical guide.